目录
AkShare 介绍
AkShare 是基于 Python 的财经数据接口库, 目的是实现对股票、期货、期权、基金、外汇、债券、指数、加密货币等金融产品的基本面数据、实时和历史行情数据、衍生数据从数据采集、数据清洗到数据落地的一套工具,主要用于学术研究目的。
可以编写 Python 代码,利用 AkShare 自动化获取股票、基金等金融数据。
项目文档:https://www.akshare.xyz/zh_CN/latest/index.html
项目Github:https://github.com/jindaxiang/akshare
用 AkShare 获取上证指数历史数据
上证指数的代码为 sh000001
pythonimport akshare as ak
stock_zh_index_daily_df = ak.stock_zh_index_daily(symbol="sh000001")
print(stock_zh_index_daily_df)
                open      high       low     close        volume
date
1990-12-19    96.050    99.980    95.790    99.980  1.260000e+05
1990-12-20   104.300   104.390    99.980   104.390  1.970000e+04
1990-12-21   109.070   109.130   103.730   109.130  2.800000e+03
1990-12-24   113.570   114.550   109.130   114.550  3.200000e+03
1990-12-25   120.090   120.250   114.550   120.250  1.500000e+03
.             .      .      .      .          ...
2020-11-05  3305.580  3320.408  3291.600  3320.133  2.268015e+10
2020-11-06  3326.465  3326.465  3292.151  3312.159  2.348641e+10
2020-11-09  3329.429  3380.824  3329.429  3373.734  3.102198e+10
2020-11-10  3387.622  3387.622  3346.172  3360.149  2.787011e+10
2020-11-11  3354.025  3365.836  3339.041  3342.203  2.712047e+10

[7307 rows x 5 columns]
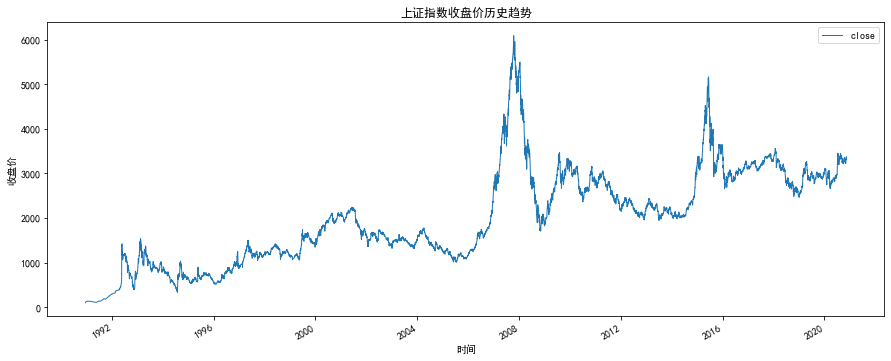
绘制上证指数历史收盘价变化趋势
单独提取出收盘价的历史数据
pythonsh000001_close = stock_zh_index_daily_df['close']
print(sh000001_close)
date
1990-12-19      99.980
1990-12-20     104.390
1990-12-21     109.130
1990-12-24     114.550
1990-12-25     120.250
                .
2020-11-05    3320.133
2020-11-06    3312.159
2020-11-09    3373.734
2020-11-10    3360.149
2020-11-11    3342.203
Name: close, Length: 7307, dtype: float64
绘制趋势图
python%matplotlib inline
import matplotlib.pyplot as plt
from pylab import mpl

mpl.rcParams['font.sans-serif'] = ['simhei'] # 指定默认字体
mpl.rcParams['axes.unicode_minus'] = False # 解决保存图像是负号'-'显示为方块的问题
mpl.rcParams['figure.figsize'] = (15.0, 6.0)

sh000001_close.plot(linewidth=1)
plt.title("上证指数收盘价历史趋势")
plt.xlabel('时间')
plt.ylabel('收盘价')
plt.legend()
plt.show()
本文作者:tsingk
本文链接:
版权声明:本博客所有文章除特别声明外,均采用 BY-NC-SA 许可协议。转载请注明出处!
目录