目录
title: 学习 seaborn [04]: 修改样式、移动座标轴 slug: beautify-seaborn date: 2020-12-11 16:23:05 tags:
- seaborn
- python category: 数据分析 link: description: type: text
控制图像的美学样式
相比与matplotlib详细的样式设置,seaborn提供了成套的样式主题可供直接使用,同时提供高级设置接口供用户自定义主题。
以装修房子比喻,用matplotlib就像全部考自己装修,窗台、地砖、墙壁等细节都要自己考虑,费时费力但高度可定制化。而用seaborn相当于从装修公司已设计好的装修方案中挑选一个,然后还能在此基础进行部分的修改定制。
显然seaborn在效率和美观之间能达到平衡。
seaborn设置样式主要用到这几个函数:
axes_style()、set_style():设置图像样式,前者用于返回样式设置的参数字典;plotting_context()、set_context():设置元素样式,前者用于返回样式设置的参数字典;despine():移除座标轴或修改座标轴位置。
使用seaborn主题
使用set()函数将主题样式从matplotlib转变为seaborn默认设置,且任何时候使用set()函数都会恢复到seaborn默认主题设置。
选择seaborn图像样式主题
seaborn内置图像样式有五个:darkgrid(默认),whitegrid,dark,white,ticks。
pythonimport seaborn as sns
import pandas as pd
import matplotlib.pyplot as plt
import numpy as np
%matplotlib inline

sns.set()
tips = pd.read_csv('seaborn-data-master/tips.csv')
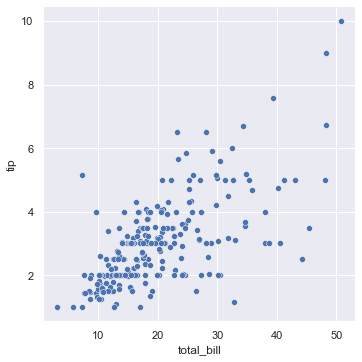
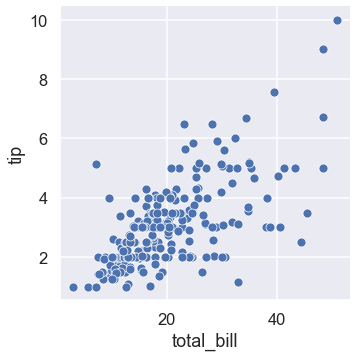
darkgrid(深色背景网格)(seaborn默认样式)
pythong = sns.relplot(x='total_bill', y='tip', data=tips)
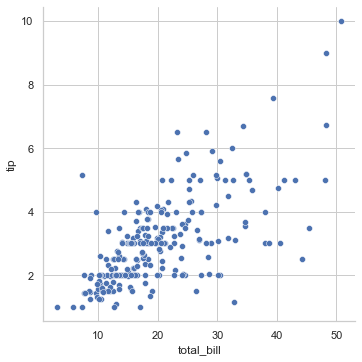
whitegrid(白色背景网格)
pythonsns.set_style('whitegrid')
g = sns.relplot(x='total_bill', y='tip', data=tips)
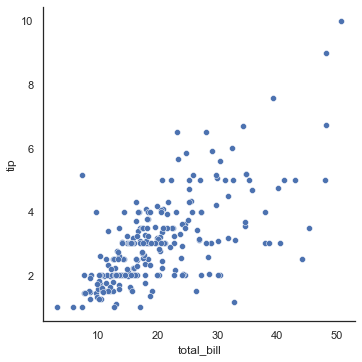
dark(深色背景无网格)
pythonsns.set_style('dark')
g = sns.relplot(x='total_bill', y='tip', data=tips)

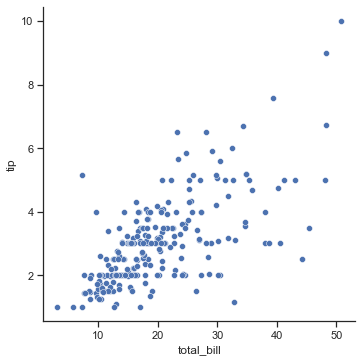
white(白色背景无网格)
pythonsns.set_style('white')
g = sns.relplot(x='total_bill', y='tip', data=tips)
ticks(白色背景无网格,座标轴带刻度线)
pythonsns.set_style('ticks')
g = sns.relplot(x='total_bill', y='tip', data=tips)
修改成套图像样式中的部分设置
使用axes_style()函数可返回seaborn内置图像样式的所有设置参数的字典。
pythonsns.axes_style()
{'axes.facecolor': 'white',
 'axes.edgecolor': '.15',
 'axes.grid': False,
 'axes.axisbelow': True,
 'axes.labelcolor': '.15',
 'figure.facecolor': 'white',
 'grid.color': '.8',
 'grid.linestyle': '-',
 'text.color': '.15',
 'xtick.color': '.15',
 'ytick.color': '.15',
 'xtick.direction': 'out',
 'ytick.direction': 'out',
 'lines.solid_capstyle': 'round',
 'patch.edgecolor': 'w',
 'patch.force_edgecolor': True,
 'image.cmap': 'rocket',
 'font.family': ['sans-serif'],
 'font.sans-serif': ['Arial',
  'DejaVu Sans',
  'Liberation Sans',
  'Bitstream Vera Sans',
  'sans-serif'],
 'xtick.bottom': True,
 'xtick.top': False,
 'ytick.left': True,
 'ytick.right': False,
 'axes.spines.left': True,
 'axes.spines.bottom': True,
 'axes.spines.right': True,
 'axes.spines.top': True}
对以上字典中的参数进行修改,形成自定义的参数字典,然后传递给set_style()中的rc参数,自定义部分的参数值会覆盖所采用主题样式的对应设置。
如以下用法:
sns.set_style('darkgrid', rc={'axes.facecolor': '.9'})
选择seaborn绘图元素样式
seaborn内置绘图元素样式有四个:paper,notebook(默认),talk,poster。名称就是差别,呈现效果是线条越来越粗、字体越来越大。
paper
pythonsns.set()  # 恢复默认设置
sns.set_context('paper')
g = sns.relplot(x='total_bill', y='tip', data=tips)

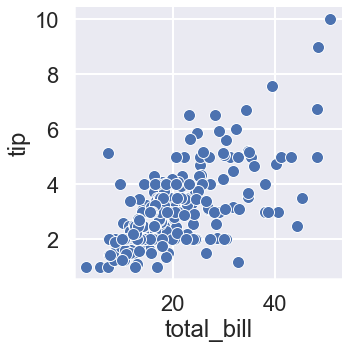
notebook(seaborn默认元素样式)
pythonsns.set_context('notebook')
g = sns.relplot(x='total_bill', y='tip', data=tips)

talk
pythonsns.set_context('talk')
g = sns.relplot(x='total_bill', y='tip', data=tips)
poster
pythonsns.set_context('poster')
g = sns.relplot(x='total_bill', y='tip', data=tips)
修改成套元素样式中的部分设置
类似与图像样式,元素样式可通过plotting_context()返回样式的设置参数字典。
pythonsns.plotting_context()
{'font.size': 24.0,
 'axes.labelsize': 24.0,
 'axes.titlesize': 24.0,
 'xtick.labelsize': 22.0,
 'ytick.labelsize': 22.0,
 'legend.fontsize': 22.0,
 'axes.linewidth': 2.5,
 'grid.linewidth': 2.0,
 'lines.linewidth': 3.0,
 'lines.markersize': 12.0,
 'patch.linewidth': 2.0,
 'xtick.major.width': 2.5,
 'ytick.major.width': 2.5,
 'xtick.minor.width': 2.0,
 'ytick.minor.width': 2.0,
 'xtick.major.size': 12.0,
 'ytick.major.size': 12.0,
 'xtick.minor.size': 8.0,
 'ytick.minor.size': 8.0,
 'legend.title_fontsize': 24.0}
对以上字典中的参数进行修改,形成自定义的参数字典,然后传递给set_context()中的rc参数,自定义部分的参数值会覆盖所采用主题样式的对应设置。
如以下用法:
sns.set_context('notebook', rc={'lines.linewidth': 2.5})
移除图像中上部和右部的座标轴
直接使用despine()函数可移除图像中上部和右部的座标轴。
由于直接使用seaborn的绘图函数,绘出的图像本就不含上部和右部的座标轴,所以despine()函数适用于直接用matplotlib绘图后的修改。
以下是根据seaborn手册的列子。
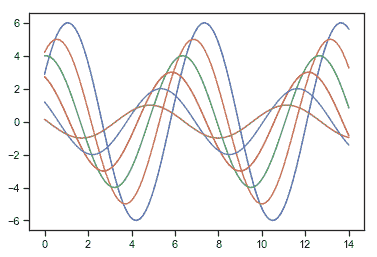
带上部和右部座标轴
sinplot()
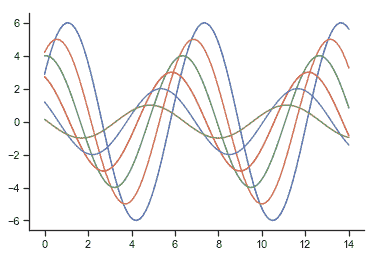
移除上部和右部座标轴
sinplot()
sns.despine()
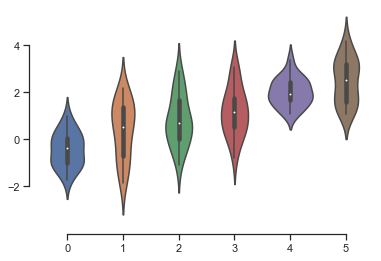
移动座标轴
使用despine()函数可以让坐标的主轴随着数据进行偏移,当刻度无法覆盖轴的整个范围时,trim参数用来限制不受影响的坐标轴的范围。
pythonsns.set()
sns.set_style('ticks')
data = np.random.normal(size=(20, 6)) + np.arange(6) / 2
sns.violinplot(data=data)
sns.despine(offset=10, trim=True)
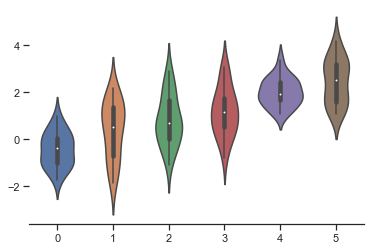
移除指定位置的座标轴
通过给despine()函数有left,right,top,bottom四个参数,取值为True和False,True意味着删除此位置的座标轴,False反之。其中right和top的默认值为True,因此直接调用despine()函数可以移除上部和右部的座标轴。
如果给left赋值True,则实现移除左部座标轴。
pythonsns.violinplot(data=data)
sns.despine(left=True)
本文作者:tsingk
本文链接:
版权声明:本博客所有文章除特别声明外,均采用 BY-NC-SA 许可协议。转载请注明出处!